

The goal is the sustained increase in the corporation’s value.
Value management
Key financial performance indicators for Continental relate to the development of sales, capital employed, the adjusted EBIT margin, as well as the amount of capital expenditure and EBIT. To allow us to use the financial performance indicators for management purposes as well, and to map the interdependencies between these indicators, we summarize them as key figures as part of a valuedriver system. Our corporate objectives center on the sustainable enhancement of the value of each individual business unit. This goal is achieved by generating a positive return on the capital employed in each respective business unit. At the same time, this return must always exceed the equity and debt financing costs of acquiring the operating capital. It is also crucial that the absolute contribution to value (Continental Value Contribution, CVC) increases year for year. This can be achieved by increasing the return on capital employed (with the costs of capital remaining constant), lowering the costs of capital (while maintaining the return on capital employed), or decreasing capital employed over time. The performance indicators used are EBIT, capital employed, and the weighted average cost of capital (WACC), which is calculated from the proportional weight of equity and debt costs.
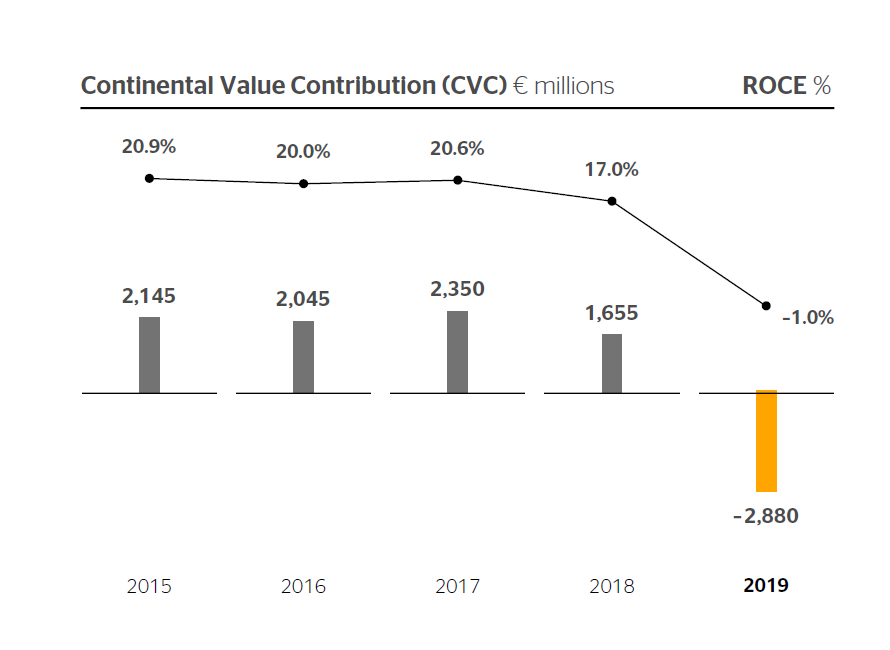
Continental Value Contribution (CVC) in € millions / ROCE in %
EBIT is calculated from the ongoing sales process. The figure is the net total of sales, other income and expenses plus income from equity-accounted investees and from investments but before financial result and income tax expense. In the year under review, consolidated EBIT amounted to -€0.3 billion.
Capital employed is the funds used by the company to generate its sales. At Continental, this figure is calculated as the average of operating assets as at the end of the quarterly reporting periods. In 2019, average operating assets amounted to €26.2 billion.
The return on capital employed (ROCE) represents the ratio of these two calculated values. Comparing a figure from the statement of income (EBIT) with one from the statement of financial position (capital employed) produces an integral analysis. We deal with the problem of the different periods of analysis by calculating the capital employed as an average figure over the ends of quarterly reporting periods. ROCE amounted to -1.0% in 2019.
The weighted average cost of capital (WACC) is calculated to determine the cost of financing the capital employed. Equity costs are based on the return from a risk-free alternative investment plus a market risk premium, taking into account Continental’s specific risk. Borrowing costs are calculated based on Continental’s weighted debt-capital cost rate. Based on the long-term average, the weighted average cost of capital for our company is about 10%.
Value is added only if ROCE exceeds the weighted average cost of capital (WACC). We call this value added, produced by subtracting WACC from ROCE multiplied by average operating assets, the Continental Value Contribution (CVC). In 2019, the CVC amounted to -€2,879.6 million.
| ROCE by division (in %) | ||||
|---|---|---|---|---|
| 2019 | 2018 | |||
| Chassis & Safety | -2.3 | 16.0 | ||
| Powertrain | -16.9 | 3.3 | ||
| Interior | -23.0 | 17.6 | ||
| Tires | 21.2 | 29.1 | ||
| ContiTech | 8.7 | 12.6 | ||
| Continental Corporation | -1.0 | 17.0 | ||
Financing strategy
Our financing strategy aims to support value-adding growth of the Continental Corporation while at the same time complying with an equity and liabilities structure adequate for the risks and rewards of our business.
The corporate function Finance & Treasury provides the necessary financial framework to finance corporate growth and secure the long-term existence of the company. The company’s annual investment requirements are likely to be between 7% and 8% of sales in the coming years.
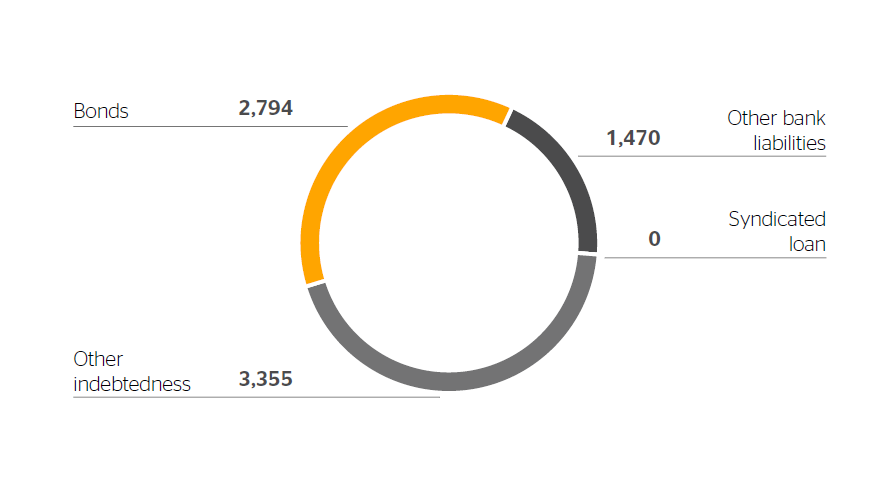
Composition of gross indebtedness (€7,619 million)
Our goal is to finance ongoing investment requirements from the operating cash flow. Other investment projects, for example acquisitions, should be financed from a balanced mix of equity and debt depending on the ratio of net indebtedness to equity (gearing ratio) and the liquidity situation to achieve constant improvement in the respective capital market environment. In general, the gearing ratio should be below 20% in the coming years and not exceed 60% in general. If justified by extraordinary financing grounds or specific market circumstances, we can rise above this maximum level under certain conditions. The equity ratio should exceed 35%. In the reporting year, it was 37.3% and the gearing ratio 25.6%.
Our gross indebtedness should be a balanced mix of liabilities to banks and other sources of financing on the capital market. For short-term financing in particular, we use a wide range of financing instruments. As at the end of 2019, this mix consisted of bonds (37%), syndicated loan (0%), other bank liabilities (19%) and other indebtedness (44%) based on the gross indebtedness of €7,619.0 million. The committed volume of the syndicated loan, which consists of a revolving tranche, now amounts to €4.0 billion since its renewal in December 2019. It previously amounted to €3.0 billion. The new syndicated loan will run until December 2024, and the interest-rate margin will now also depend on the corporation’s sustainability performance. In accordance with the new standard IFRS 16, Leases, the application of which has been mandatory since January 1, 2019, all leases must be recognized in the statement of financial position. As a result, lease liabilities included in other indebtedness increased significantly to €1.7 billion as at December 31, 2019. The financing mix is not likely to change significantly.
The company strives to have at its disposal unrestricted liquidity of about €1.5 billion. This is supplemented by committed, unutilized credit lines from banks in order to cover liquidity requirements at all times. These requirements fluctuate during a calendar year owing in particular to the seasonal nature of some business areas. In addition, the amount of liquidity required is also influenced by corporate growth. Unrestricted cash and cash equivalents amounted to €3,114.3 million as at December 31, 2019. There were also committed and unutilized credit lines of €4,702.2 million.
Gross indebtedness amounted to €7,619.0 million as at December 31, 2019. Key financing instruments are the syndicated loan with a revolving credit line of €4.0 billion that has been granted until December 2024 and bonds issued on the capital market.
As at December 31, 2019, this revolving credit line had not been utilized. Around 37% of gross indebtedness is financed on the capital market in the form of bonds. The interest coupons vary between 0.0% and 3.9%. The issue of new bonds in the third and fourth quarters of 2019 with maturities between 2021 and 2025 led to a balanced overall maturity profile of the repayment amounts. In addition to the forms of financing already mentioned, there were also bilateral credit lines with various banks in the amount of €2,210.2 million as at December 31, 2019. Continental’s corporate financing instruments currently also include sale-of-receivables programs and commercial paper programs. In 2019, the Continental Corporation had two commercial paper programs in Germany and the U.S.A.
Maturity profile
Continental always strives for a balanced maturity profile of its liabilities in order to be able to repay the amounts due each year from free cash flow as far as possible. Other than short-term maturities, which are usually rolled on to the next year, the repayment of the €600.0-million and €750.0-million bonds maturing in February and September 2020 is also particularly high on the agenda for 2020. The bonds issued in the third and fourth quarters of 2019 require repayments of €200.0 million in 2021, €500.0 million in 2023, €100.0 million in 2024 and €600.0 million in 2025.
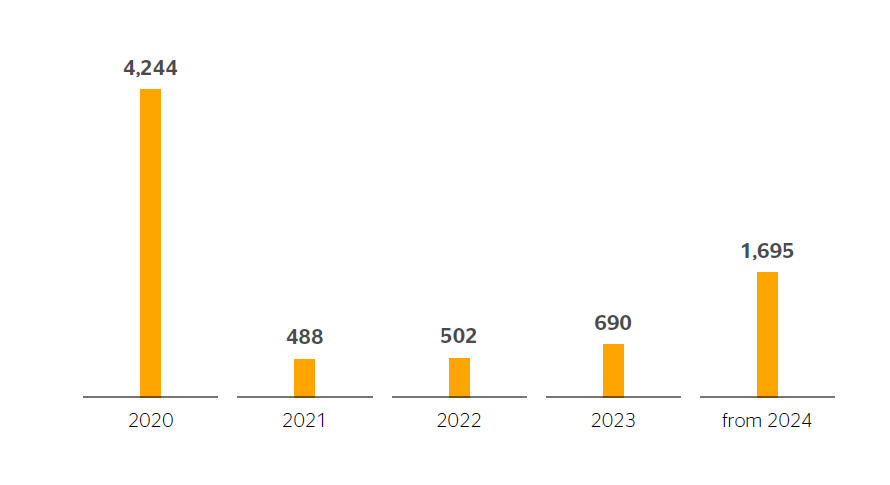
Maturities of gross indebtedness (€7,619 million)
In the reporting period, Continental AG was rated by the three rating agencies Standard & Poor’s, Fitch and Moody’s, each of which maintained their credit ratings during 2019. In August 2019, Moody’s modified its outlook from stable to negative. Our goal remains a credit rating of BBB/BBB+.
| Credit rating for Continental AG | ||||
|---|---|---|---|---|
| December 31, 2019 | December 31, 2018 | |||
| Standard & Poor’s1 | ||||
| Long term | BBB+ | BBB+ | ||
| Short term | A-2 | A-2 | ||
| Outlook | stable | stable | ||
| Fitch2 | ||||
| Long term | BBB+ | BBB+ | ||
| Short term | F2 | F2 | ||
| Outlook | stable | stable | ||
| Moody’s3 | ||||
| Long term | Baa1 | Baa1 | ||
| Short term | no rating | no rating | ||
| Outlook | negative | stable | ||
1 Contracted rating since May 19, 2000.
2 Contracted rating since November 7, 2013.
3 Contracted rating since January 1, 2019.