

- Sales up 0.2% at €44.5 billion
- Organic sales down 2.6%
- Basic earnings per share at -€6.13
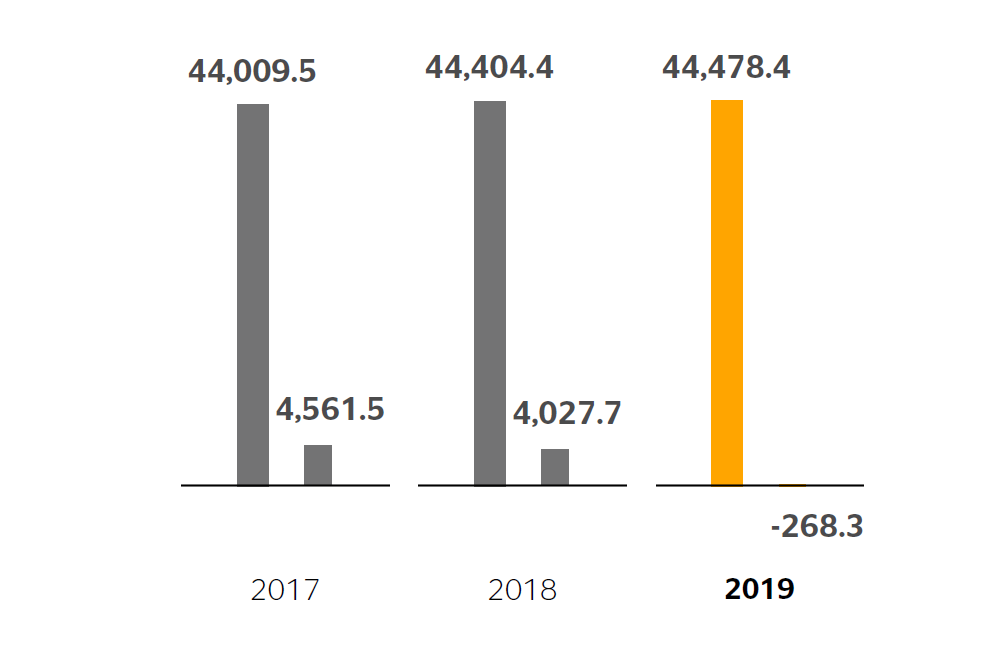
Sales; EBIT (€ millions)
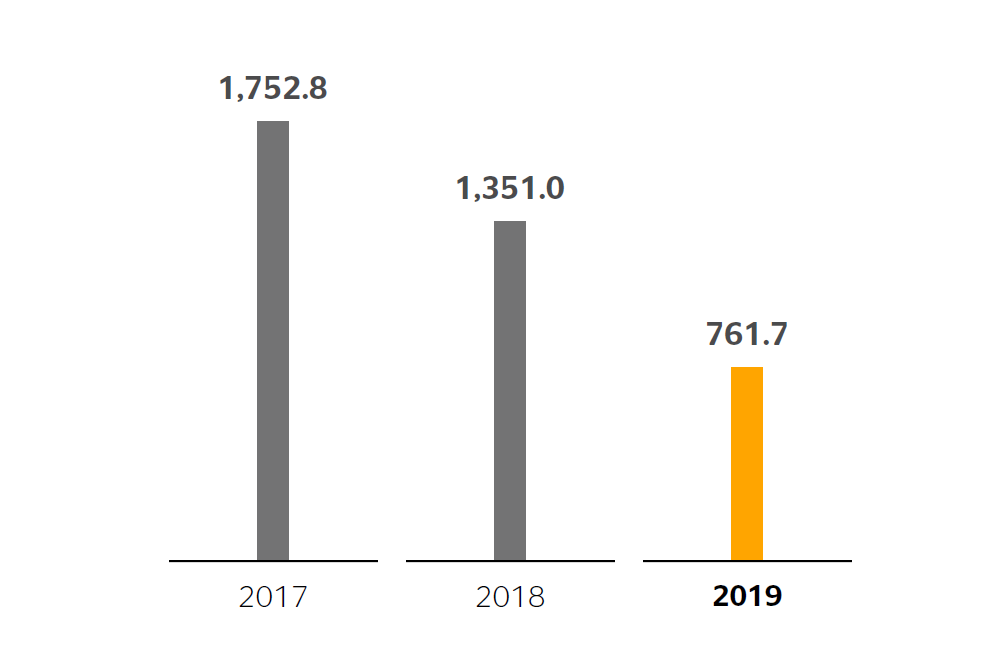
Free cash flow (€ millions)
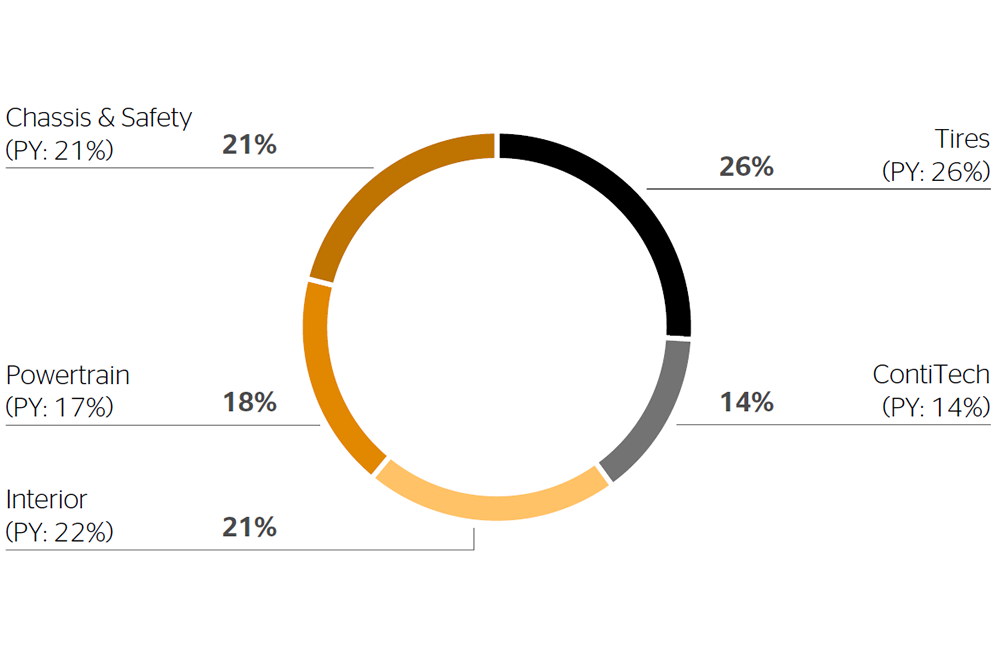
Sales by division (%)
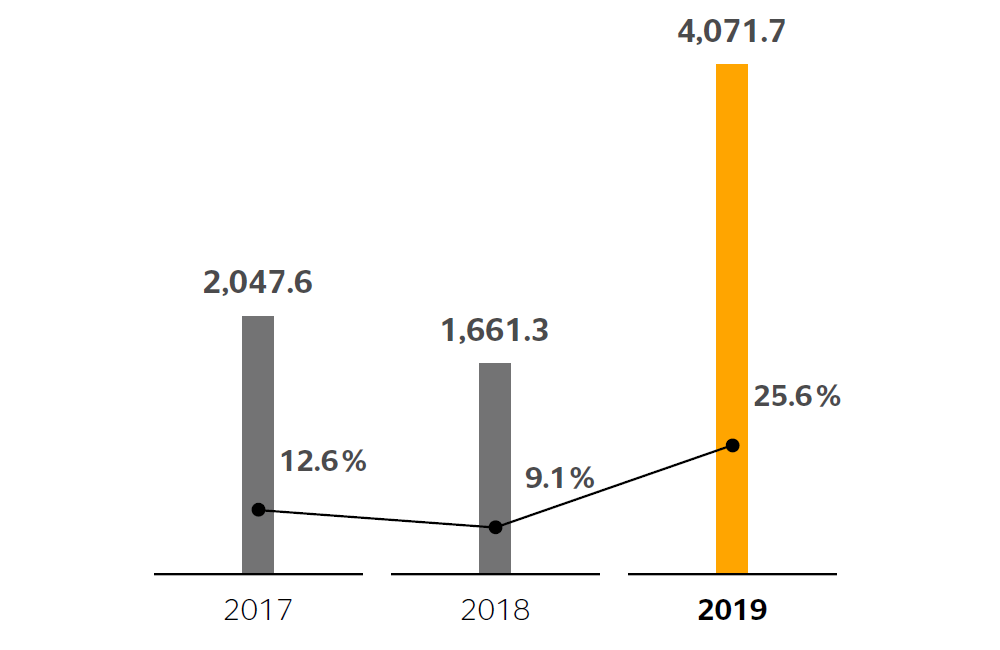
Net indebtedness (€ millions) / Gearing ratio (%)
Compared to the pdf-version the following chapters are not included here:
- Earnings, Financial and Net Assets Position [pp. 59-83]
- Continental AG (Short Version in acc. with HGB) [pp. 84-86]
- Other Information [pp. 87-89]
- Report on Risks and Opportunities [pp. 90-99]
- Notes to the Consolidated Financial Statements [pp. 118-204]