

4.5% decrease in Continental share price.
Recovery on stock markets
After the price declines in the fourth quarter of 2018, stock markets worldwide stabilized over the course of the first quarter of 2019. The turnaround in sentiment was due to surprisingly positive U.S. job market data, the Chinese government’s announcement of new measures to tackle the economic slowdown and, in particular, growing hopes of conciliation in the trade dispute between the U.S.A. and China. In addition, there was speculation about a suspension of interest-rate increases by the U.S. Federal Reserve (Fed).
The recovery of stock markets continued in April 2019, supported by positive economic data from the U.S.A., Europe and China as well as signs of an easing in the trade dispute between the U.S.A. and China. In May 2019, the surprising introduction of new U.S. import tariffs on Chinese goods and subsequent countermeasures by the Chinese government resulted in a change of sentiment and a price slide on stock markets worldwide. In June 2019, new signs of an easing in the trade dispute between the U.S.A. and China as well as speculation about falling interest rates led to a renewed rise in share prices.
Over the course of July 2019, several profit warnings from major companies and declining economic data had a negative impact on the European stock markets. The surprising announcement of new U.S. tariffs on Chinese imports at the beginning of August 2019 caused share prices to slump worldwide. Leading economic indicators were also weaker than expected, fueling fears of a recession in Europe as the month progressed. In September 2019, hopes of support measures from central banks caused share prices to rally.
At the beginning of October 2019, fears of a recession initially weighed on stock markets. As the fourth quarter progressed, falling interest rates in the U.S.A. and positive economic data from the U.S.A. and China led to gains on the global stock markets. In addition, hopes grew that an end to the trade conflict between the U.S.A. and China was imminent. This expectation was further reinforced in mid-December when a partial agreement was announced. In Europe, the Conservative Party’s clear victory in the U.K. general election in December led to strong gains for British stocks, which also benefited other European stock markets. The DAX surpassed the 13,000-point mark at the beginning of November 2019 and ended the year at 13,249.01 points. Compared to the start of 2019, it gained 25.5%. The EURO STOXX 50 increased 24.8% year-on-year and ended 2019 at 3,745.15 points.
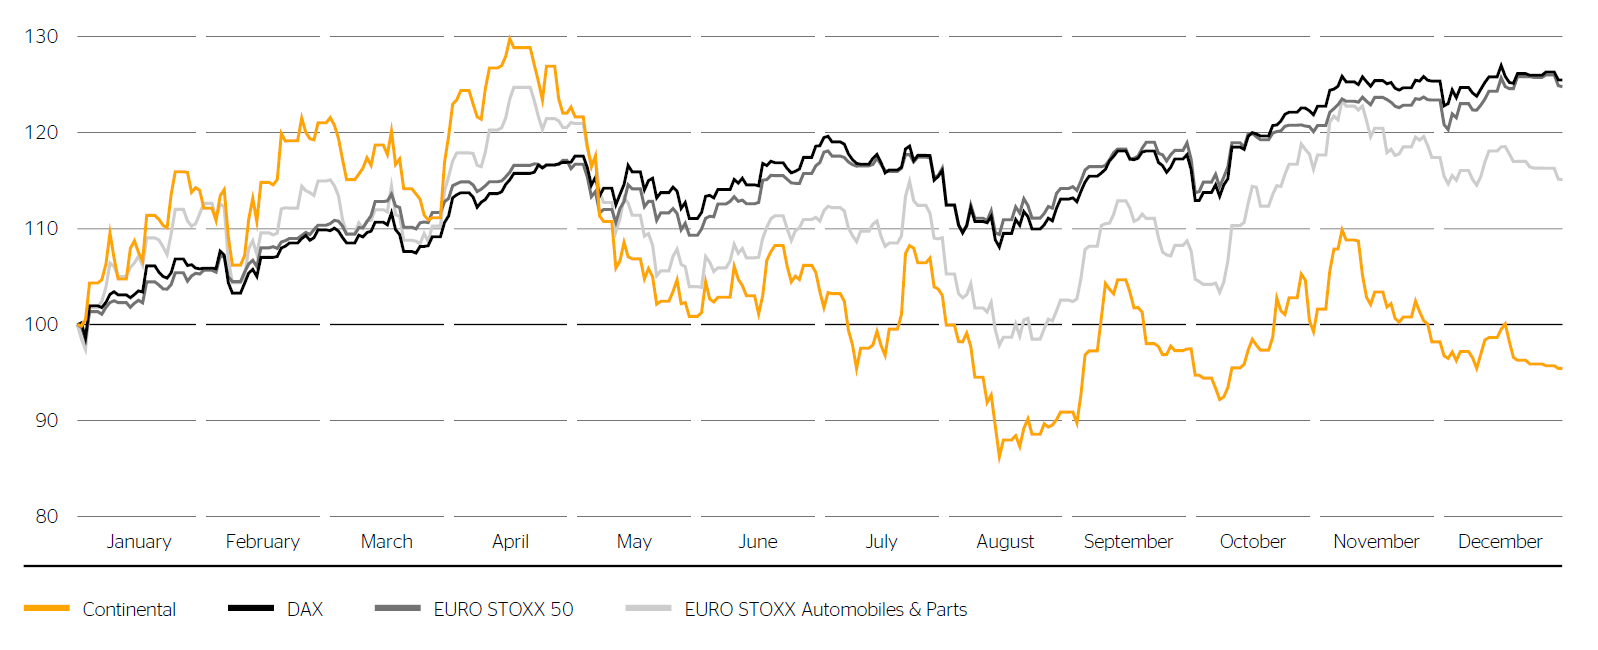
Price performance of Continental shares in 2019 versus selected stock indexes
(indexed to January 1, 2019)
Declining demand for passenger cars impacts automotive stocks
In January and February 2019, European automotive and supplier stocks benefited from hopes of conciliation in the trade dispute between the U.S.A. and China. However, this sector was hit hard in February and March by considerably lower company profits in fiscal 2018 and cautious forecasts for fiscal 2019 because of weak demand in Europe and China. Sentiment also dimmed as a result of the weaker economic forecasts by the European Central Bank and the Fed, as well as the announcement of possible U.S. import tariffs on European cars.
In April 2019, the European automotive sector benefited from the growing expectations of conciliation in the trade dispute between the U.S.A. and China. The surprising escalation of the dispute and persistently weak passenger-car sales figures for Europe, the U.S.A. and especially China led to a sharp decline in the sector in May. This was exacerbated by fears of possible punitive U.S. tariffs on imports from Mexico and on imports of European cars to the U.S.A. In June 2019, the sector stabilized as a result of the positive general market trend.
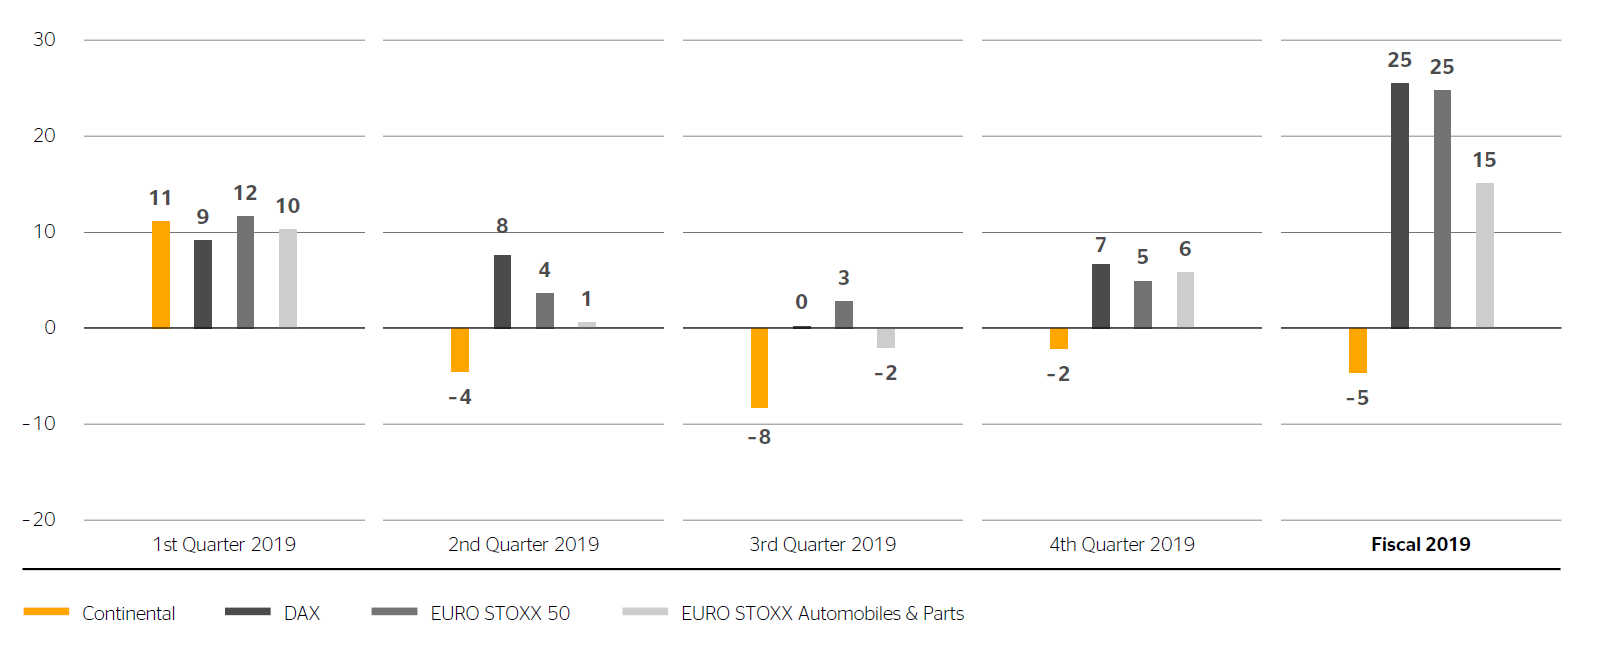
Price performance by quarter in 2019 (in %)
The European automotive sector largely followed the overriding market trends in the third quarter of 2019. However, it was negatively impacted by various profit warnings from manufacturers and suppliers. In addition, global production volumes for passenger cars continued to decline in 2019 and companies lowered their production expectations for the coming years.
Automotive stocks in particular benefited in the fourth quarter from the growing hopes of an agreement in the trade conflict between the U.S.A. and China. From mid-November 2019, however, fears of stagnating or even slightly declining vehicle production in 2020 and in the following years led to profit taking. The EURO STOXX Automobiles & Parts ended 2019 at 486.20 points, gaining 15.1% on the previous year.
Volatile price performance of Continental shares
After the significant price declines in 2018, Continental shares climbed by over 20% to €148.50 by the beginning of March 2019. As the month progressed, the announcement of the full business figures for 2018 and the confirmation of the outlook for the challenging fiscal 2019 together with sinking economic forecasts led to profit taking by investors. Compared with their closing price for 2018, Continental shares nevertheless increased by 11.1% to €134.20 in the first quarter of 2019.
Continental shares followed the trend in the European automotive sector in the second quarter of 2019 but were much more volatile. They were briefly quoted at over €155 in mid-April, representing an increase of 30.4% compared to the start of the year. In May 2019, Continental shares were particularly affected by the slump in the sector and fell back to their level at the beginning of the year. They declined by 4.5% in the second quarter to €128.22.
In the third quarter of 2019, declining expectations concerning production volumes in the reporting year and the lowering of the forecast for fiscal 2019 led to a reduction in the Continental share price to €103.62 as at the middle of August. Over the remainder of the quarter, Continental shares mostly followed the trend in the European automotive sector. They closed the third quarter with a loss of 8.2% at €117.70.
In the fourth quarter of 2019, Continental shares were down 2.1%, having been negatively impacted by weak market data and concerns about decreases in production volumes in 2020. They ended the reporting year 4.5% lower overall at €115.26.
In terms of its share-price performance, Continental was at the bottom end in the annual ranking of the 30 DAX shares in 2019, taking 28th place (PY: 28th place). Allowing for an immediate reinvestment of the dividend distribution of €4.75, Continental shares generated a total return of -1.5% in 2019. The DAX achieved a return of 25.5% in 2019, the EURO STOXX 50 of 29.3% and the EURO STOXX Automobiles & Parts of 21.1% (including reinvested dividends in each case).
Continental bonds continue at low yield level
As in the previous year, Continental bonds persisted at a low yield level in 2019. The slight decline in the interest-rate level for corporate bonds in Europe had a positive influence on the prices of Continental bonds in the reporting period. The price of the 0.0% euro bond maturing on February 5, 2020, increased by 12.1 basis points in the first quarter, before falling by 13.5 basis points over the course of the year. The price of the 3.125% euro bond maturing on September 9, 2020, decreased by 267.4 basis points in the reporting period, primarily due to the reduction in its remaining maturity.
| Continental’s key bonds outstanding as at December 31, 2019 | ||||||
|---|---|---|---|---|---|---|
| WKN/ISIN | Coupon | Maturity | Volume in € millions | Issue price | Price as at Dec. 31, 2019 | Price as at Dec. 31, 2018 |
| A2DARM/XS1529561182 | 0.000 % | February 5, 2020 | 600.0 | 99.410 % | 100.027 % | 100.041 % |
| A1X3B7/XS0969344083 | 3.125 % | September 9, 2020 | 750.0 | 99.228 % | 102.311 % | 104.985 % |
| A2YPE5/XS2051667181 | 0.000 % | September 12, 2023 | 500.0 | 99.804 % | 99.308 % | - |
| A2YPAE/XS2056430874 | 0.375 % | June 27, 2025 | 600.0 | 99.802 % | 99.780 % | - |
0.5% euro bond redeemed
The price of the 0.5% euro bond of Continental Rubber of America, Corp., Wilmington, Delaware, U.S.A., maturing on February 19, 2019, was around the 100% mark in January and February 2019. The nominal value of €500.0 million was repaid on the maturity date.
Successful placement of two euro bonds
In September 2019, Continental AG successfully placed two euro bonds with investors in Germany and abroad under Continental’s Debt Issuance Programme (DIP). The first euro bond was offered on September 5, 2019, with an interest coupon of 0.000%. With a nominal value of €500.0 million, the issue price amounted to 99.804%. The bond has a term of four years. It was issued on the regulated market of the Luxembourg Stock Exchange on September 12, 2019. The second euro bond was offered on September 19, 2019, with an interest coupon of 0.375%. With a nominal value of €600.0 million, the issue price amounted to 99.802%. The bond has a term of five years and nine months. It was issued on the regulated market of the Luxembourg Stock Exchange on September 27, 2019.
Special effects result in negative earnings per share
Net income attributable to the shareholders of the parent totaled -€1.23 billion (PY: €2.90 billion) in the year under review. The primary reasons for this were the weaker operating performance and the negative impact of special effects totaling €3.31 billion, which mainly comprised impairment and restructuring expenses in the third and fourth quarters of 2019. Earnings per share fell as a result to -€6.13 (PY: €14.49).
Dividend proposal of €4.00 per share
Despite the weaker operating performance, the Executive Board and the Supervisory Board have resolved to propose a dividend distribution of €4.00 per share for the past fiscal year to the Annual Shareholders’ Meeting to be held in Hanover on April 30, 2020. This proposal corresponds to a payout of €800.0 million. Based on the dividend proposal and the annual average Continental share price, this results in a dividend yield of 3.1% for 2019.
A dividend of €4.75 per share was paid for fiscal 2018, amounting to a total payout of €950.0 million. The dividend payout ratio was 32.8%, and the dividend yield was 2.5%.
Free float unchanged at 54.0%
As in the previous year, free float as defined by Deutsche Börse AG amounted to 54.0% as at the end of 2019. The most recent change took place on September 17, 2013, when our major shareholder, the IHO Group, Herzogenaurach, Germany, announced the sale of 7.8 million Continental shares, reducing the shareholding in Continental AG from 49.9% to 46.0%.
As at the end of 2019, the market capitalization of Continental AG amounted to €23.1 billion (PY: €24.2 billion). Market capitalization on the basis of free float averaged €12.7 billion over the last 20 trading days of 2019 (PY: €13.6 billion). The trading volume, which is also relevant for the index selection by Deutsche Börse AG, amounted to €21.1 billion from January to December 2019 (PY: €28.9 billion). Among the 30 DAX shares, Continental shares as at the end of 2019 were ranked 25th (PY: 24th) in terms of free-float market capitalization and 17th (PY: 16th) in terms of stock exchange turnover.
Share of free float in the U.S.A. rises further
As at the end of the year, we determined the distribution of free float of Continental shares by way of shareholder identification (SID). We were able to assign 92.3 million of the 108.0 million shares held in the form of shares or alternatively as American depositary receipts (ADRs) in the U.S.A. to institutional and private investors. The identification ratio was 85.5% (PY: 86.5%).
A total of 83.2 million shares were attributable to more than 600 institutional investors in 44 countries. Private shareholders in Germany, other European countries and the U.S.A. held an estimated 9.2 million shares as at the end of the year.
According to the SID, the identified level of Continental shares held in Europe decreased significantly compared with the previous year to 51.1% (PY: 56.8%). The identified level of shares held by institutional investors from the United Kingdom and Ireland remained stable at 25.3%. The identified holdings of German institutional investors dropped to 6.6% in the year under review (PY: 10.0%). At 5.9%, shareholdings of private German shareholders were slightly higher than the previous year’s level of 5.7%. Shareholdings of French institutional investors decreased to 3.1% (PY: 5.9%). Scandinavian investors held 4.4% (PY: 3.2%) of Continental shares at the end of 2019. Shareholdings of institutional investors in other European countries declined to 5.7% (PY: 6.7%).
| Continental share data | |
|---|---|
| Type of share | No-par-value share |
| German stock exchanges (regulated market) | Frankfurt (Prime Standard), Hamburg, Hanover, Stuttgart |
| German securities code number (WKN) | 543900 |
| ISIN | DE0005439004 |
| Reuters ticker symbol | CONG |
| Bloomberg ticker symbol | CON |
| Index memberships (selection) | DAX Prime All Share Prime Automobile NISAX |
| Outstanding shares as December 31, 2019 | 200,005,983 |
| Free float as at December 31, 2019 | |
| Continental’s American depositary receipt (ADR) data | |
|---|---|
| Ratio | 1 share : 10 ADRs |
| SEDOL number | 2219677 |
| ISIN | US2107712000 |
| Reuters ticker symbol | CTTAY.PK |
| Bloomberg ticker symbol | CTTAY |
| ADR Level | Level 1 |
| Trading | OTC |
| Sponsor | Deutsche Bank Trust Company Americas |
| ADRs issued as at December 31, 2019 | 19,351,520 (with 1,935,152 Continental shares deposited) |
As at the end of December 2019, institutional and private investors in the U.S.A. and Canada held a total of 30.9% (PY: 26.3%) of the free float in the form of shares or ADRs.
The identified shareholdings of institutional investors in Asia, Australia and Africa came to 3.6% at the end of 2019 (PY: 3.5%).
Share capital unchanged
As at the end of 2019, the share capital of Continental AG still amounted to €512,015,316.48. It is divided into 200,005,983 no-par-value shares with a notional value of €2.56 per share. Each share has the same dividend entitlement.
In line with Article 20 of Continental AG’s Articles of Incorporation, each share grants one vote at the Shareholders’ Meeting. The current Articles of Incorporation are available on our website at www.continental.com under Company/Corporate Governance.
Continental share listings
Continental’s shares continue to be officially listed on the German stock exchanges in Frankfurt, Hamburg, Hanover and Stuttgart on the regulated market. They are also traded on other unofficial stock exchanges in Germany and in other countries around the world.
Continental ADR listings
In addition to being listed on European stock exchanges, Continental shares are traded in the U.S.A. as part of a sponsored ADR program on the over-the-counter (OTC) market. They are not admitted to the U.S. stock market. Since the split of the outstanding ADRs at the end of October 2018, ten ADRs (rather than the previous five) are equivalent to one Continental share.
Continental Investor Relations online
For more information about Continental shares, bonds and credit ratings, please visit www.continental-ir.de.
| Key figures of the Continental share1 | ||
|---|---|---|
| € (unless otherwise specified) | 2019 | 2018 |
| Basic earnings per share | -6.13 | 14.49 |
| Diluted earnings per share | -6.13 | 14.49 |
| Dividend per share | 4.002 | 4.75 |
| Dividend payout ratio (%) | n. a. | 32.8 |
| Dividend yield (%) | 3.12 | 2.5 |
| Annual average price-earnings ratio (P/E ratio)3 | n. a. | 13.2 |
| Share price at year end | 115.26 | 120.75 |
| Annual average share price | 127.58 | 191.27 |
| Share price at year high | 157.40 | 257.40 |
| Share price at year low | 103.62 | 119.10 |
| Number of outstanding shares, average (in millions) | 200.0 | 200.0 |
| Number of outstanding shares as at December 31 (in millions) | 200.0 | 200.0 |
1 All market prices are quotations of the Continental share in the Xetra system of Deutsche Börse AG.
2 Subject to the approval of the Annual Shareholders’ Meeting on April 30, 2020.
3 Net income attributable to the shareholders of the parent per share at the annual average share price.